

The annual report. A tedious paperwork exercise or an opportunity to shine?
When was the last time you got excited over an annual report? Seriously. When was the last time you read through to the end because you were captivated by the content? Not recently, you say. Well, contrary to popular belief, it can happen. There are some corkers out there.
It’s that time of year when many of our clients are preparing their annual reports and considering how to improve on previous years. How can we do something different, avoid the dull ‘greyness’ of financial info and blocks of heavy content. How to make them more appealing, more vibrant and more…well… readable. Because ultimately, that’s the whole point.
This should be about making the data come to life.
People adore facts, figures and vibrant visuals – so an annual report could be just like a Christmas present you can’t wait to open, right?
Whether you’re a non-profit association or a public company, the annual report is an opportunity to promote what your organisation does and what you can achieve. It needn’t be just a tick-box exercise. It’s a great way to showcase accomplishments, enhance brand values and awareness, cultivate new partnerships, and recognise people who have made a contribution to your organisation over the year.
Every report has its ‘must haves’, but that doesn’t mean it can’t inspire its audience. Here are some thoughts on how to do just that:
- UNDERSTAND YOUR AUDIENCE. Know your stakeholders and their consumption habits. Are they only interested in digital documents or do they prefer hard copy reports? Not everyone will have access to online files so you may need to consider creating different options to satisfy both requirements. Cost will play a major part here too – you could create an online version as the primary tool and have a short print run of the physical version for those who need it. Sometimes there’s no replacement for a tangible hardcopy that directors can carry round or post out to influential parties. Think about surveying your stakeholders to find out what they liked about previous reports and what their preferences are when it comes to future formats.
- KEEP YOUR LAYOUT CLEAR AND EASY TO READ. Make it an effortless experience. Easy navigation of the document is crucial – on or offline. Make it obvious when sections start and finish.
- BE VISUAL. It’s worth remembering that the brain processes visuals 60,000 times faster than text – images rule. Strong graphics and illustrations create impactful, memorable content. They break up pages and chunks of heavy text, lifting the document and making it more interesting and more personal.
- STRIKE A CHORD WITH A FEW KEY FACTS AND FIGURES. Highlight some meaty and memorable stats, the ones that people will recall in conversations and tell their friends and colleagues about. Think about having a ‘This Year in Numbers’ page to highlight key achievements over the past year in a bite-size way. For a human element, add a narrative alongside from your financial director – feature pull–out quotes that’ll pack a punch.
- GO INTERACTIVE. Interactive reports can be easy-to-navigate and user-friendly, allowing your viewer to fully engage, exploring the information most relevant to them by using simple navigation. This can be achieved using a basic website structure or software apps, turning content into highly interactive digital publications. Another great benefit of a digital report is that it will broaden your audience, getting naturally discovered online all year round, rather than just seen by those on your distribution list. Think about adding animation or videos from the CEO or CFO. For a slightly different approach why not get input from ‘frontline’ employees – provide a script and ask them to present the numbers.
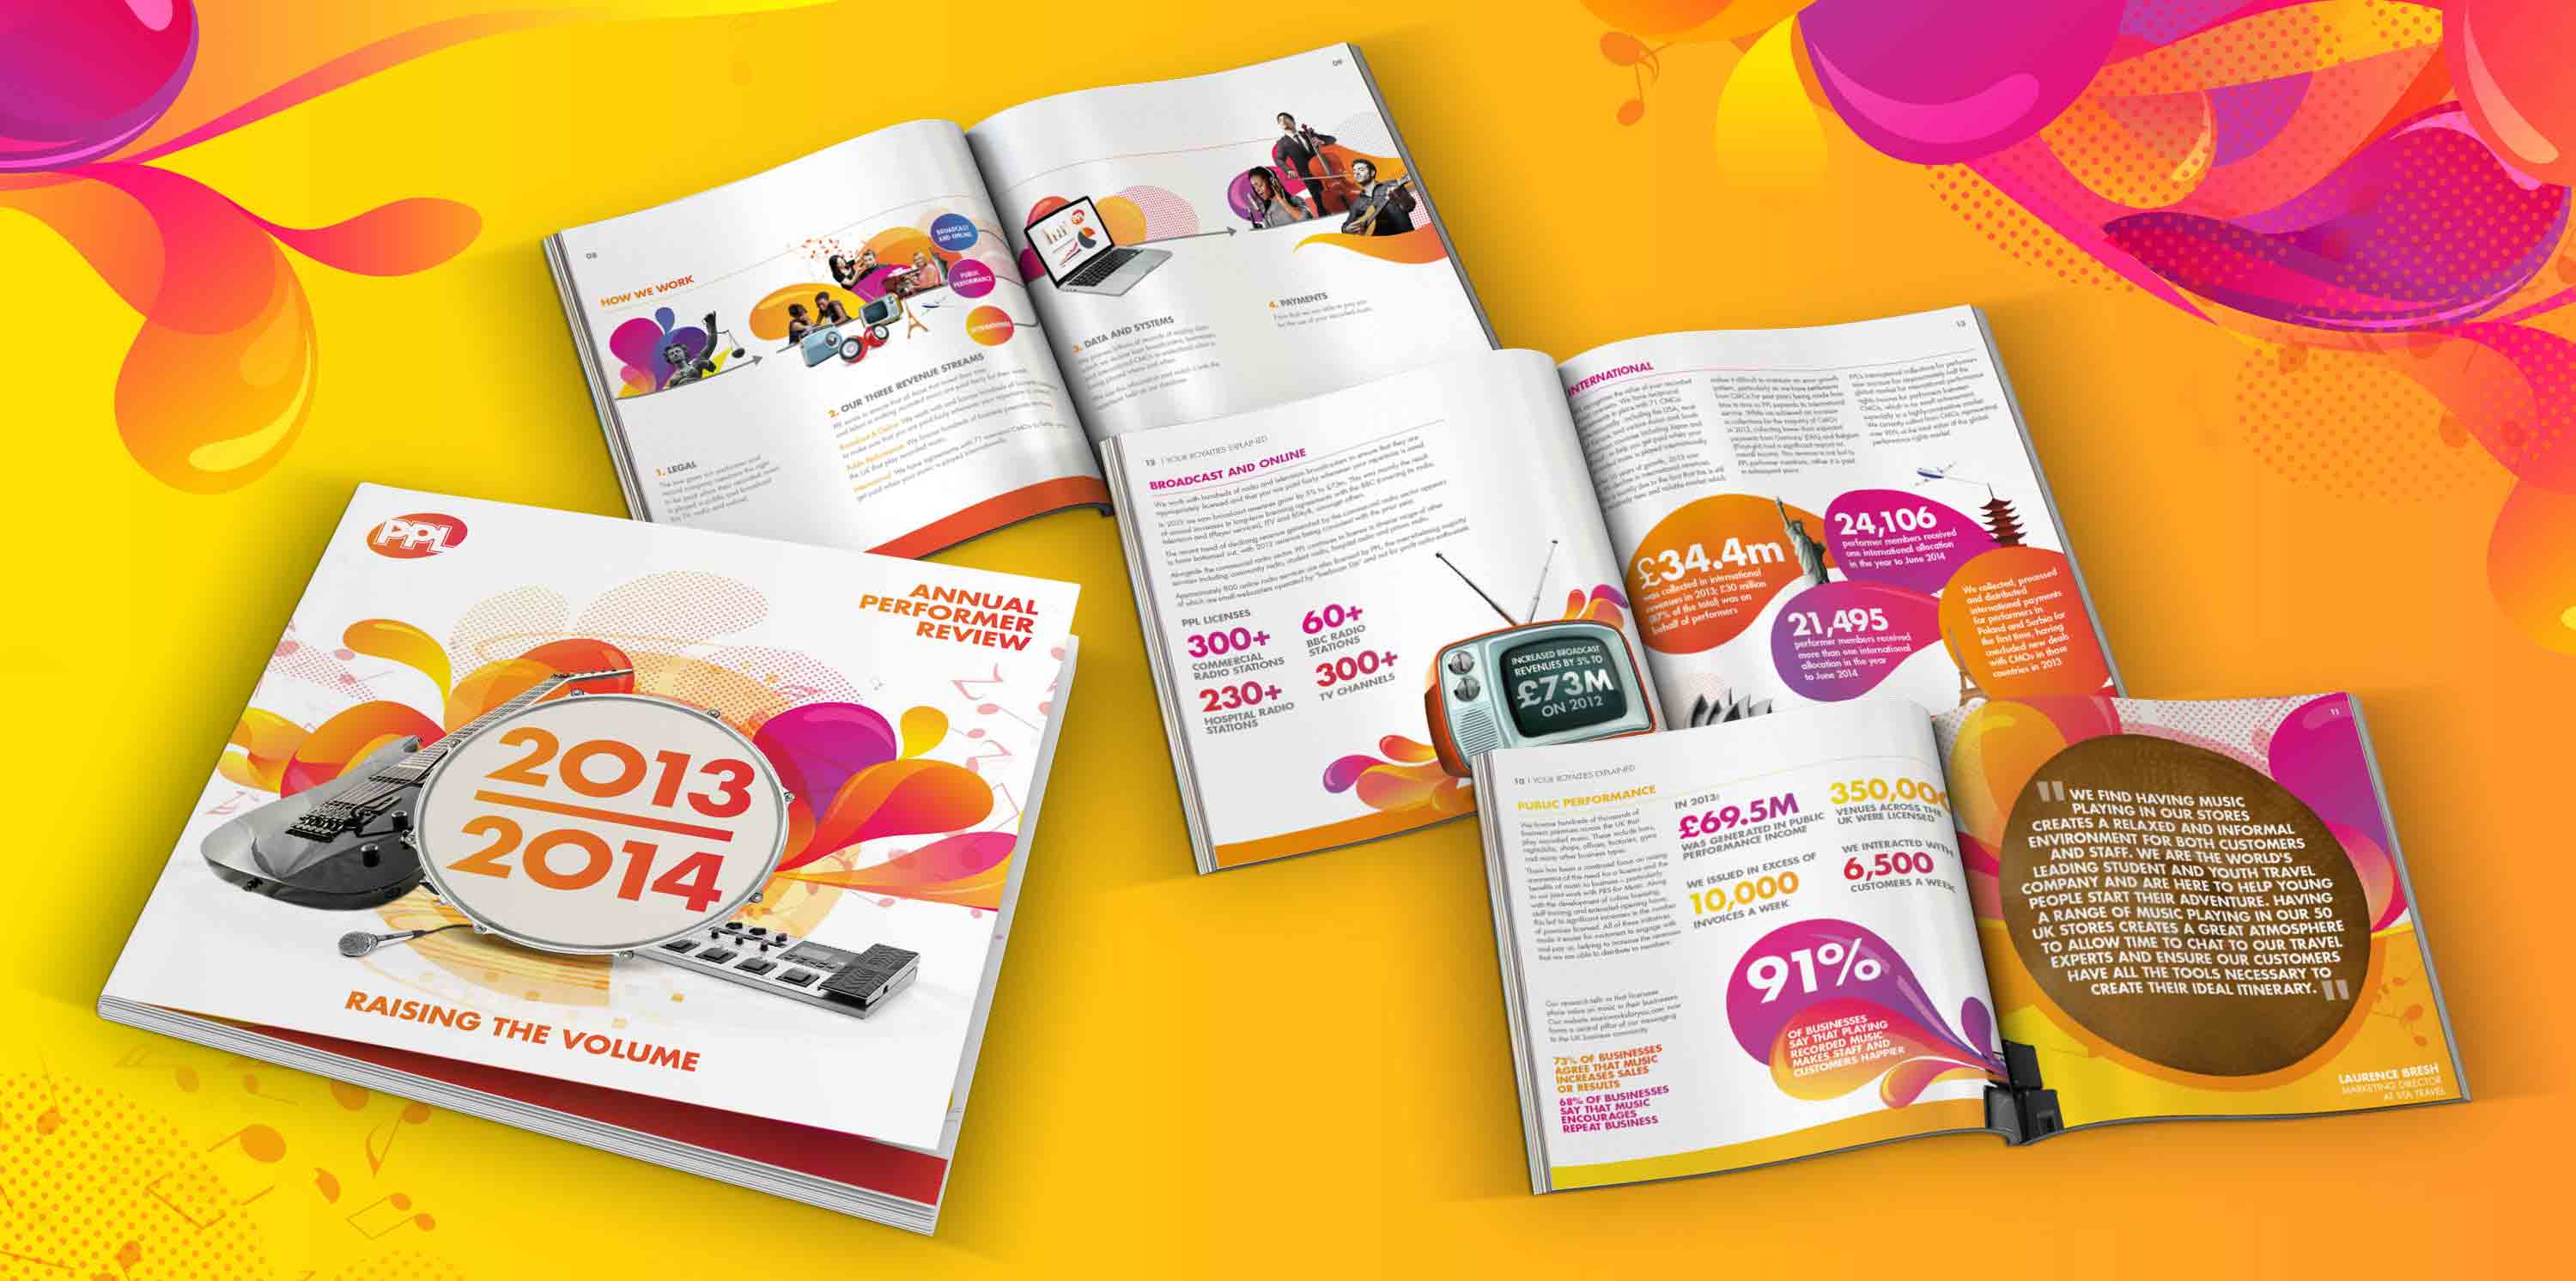
Created by Alive
- INCORPORATE INFOGRAPHICS. Did you know that an infographic is 30 times more likely to be read than a text-only article? Smart infographics help to simplify complex and large amounts of information, emphasising key facts and making reports quick and easy-to-read. They lighten and brighten heavy documents and draw the eye to significant sections. Think about sharing the infographic as a standalone piece, giving quick insight into the year.
- INCLUDE QUOTES FROM EMPLOYEES. There’s nothing like the words that come straight from the horse’s mouth to bring something to life. It’s powerful stuff. We regularly include employee insight, snappy quotes and quirky comments in all sorts of external and internal reports, updates and other branded material.
- TELL A STORY. Some of the best reports we’ve seen have a clear narrative running throughout to maintain interest and bring them to life. Share the ‘story of the year’, the journey of a customer or create a character to tell the story and appear throughout the report.
- LESS IS MORE. Nobody is interested in information overload. Satisfy regulations and required criteria and then be selective with the rest. Think about what you really need to focus on and what your audience is expecting to see. You can always add a more detailed account to your website with the more in-depth reporting for those who want it.
- CONSISTENCY IS ESSENTIAL. It’s important to create something engaging, something different that will stand out and inspire your reader to absorb. Still bear in mind the purpose of your report – to give shareholders and other interested people information about your organisation’s activities and financial performance. Your messages must be clear and consistent. People must be able to get the detail they’re looking for quickly and easily. Inconsistency and haphazard messaging will never go down well.
Final thoughts
Once you’ve invested time and money into the process, you’ll want to make the most of it. Rather than focusing too heavily on outputs and financial results, put the spotlight on your outcomes. Talk about the impact your organisation is making and the people its affecting. And finally, put yourself in the shoes of your reader and consider – would you be inspired by what you see and eager to read on?
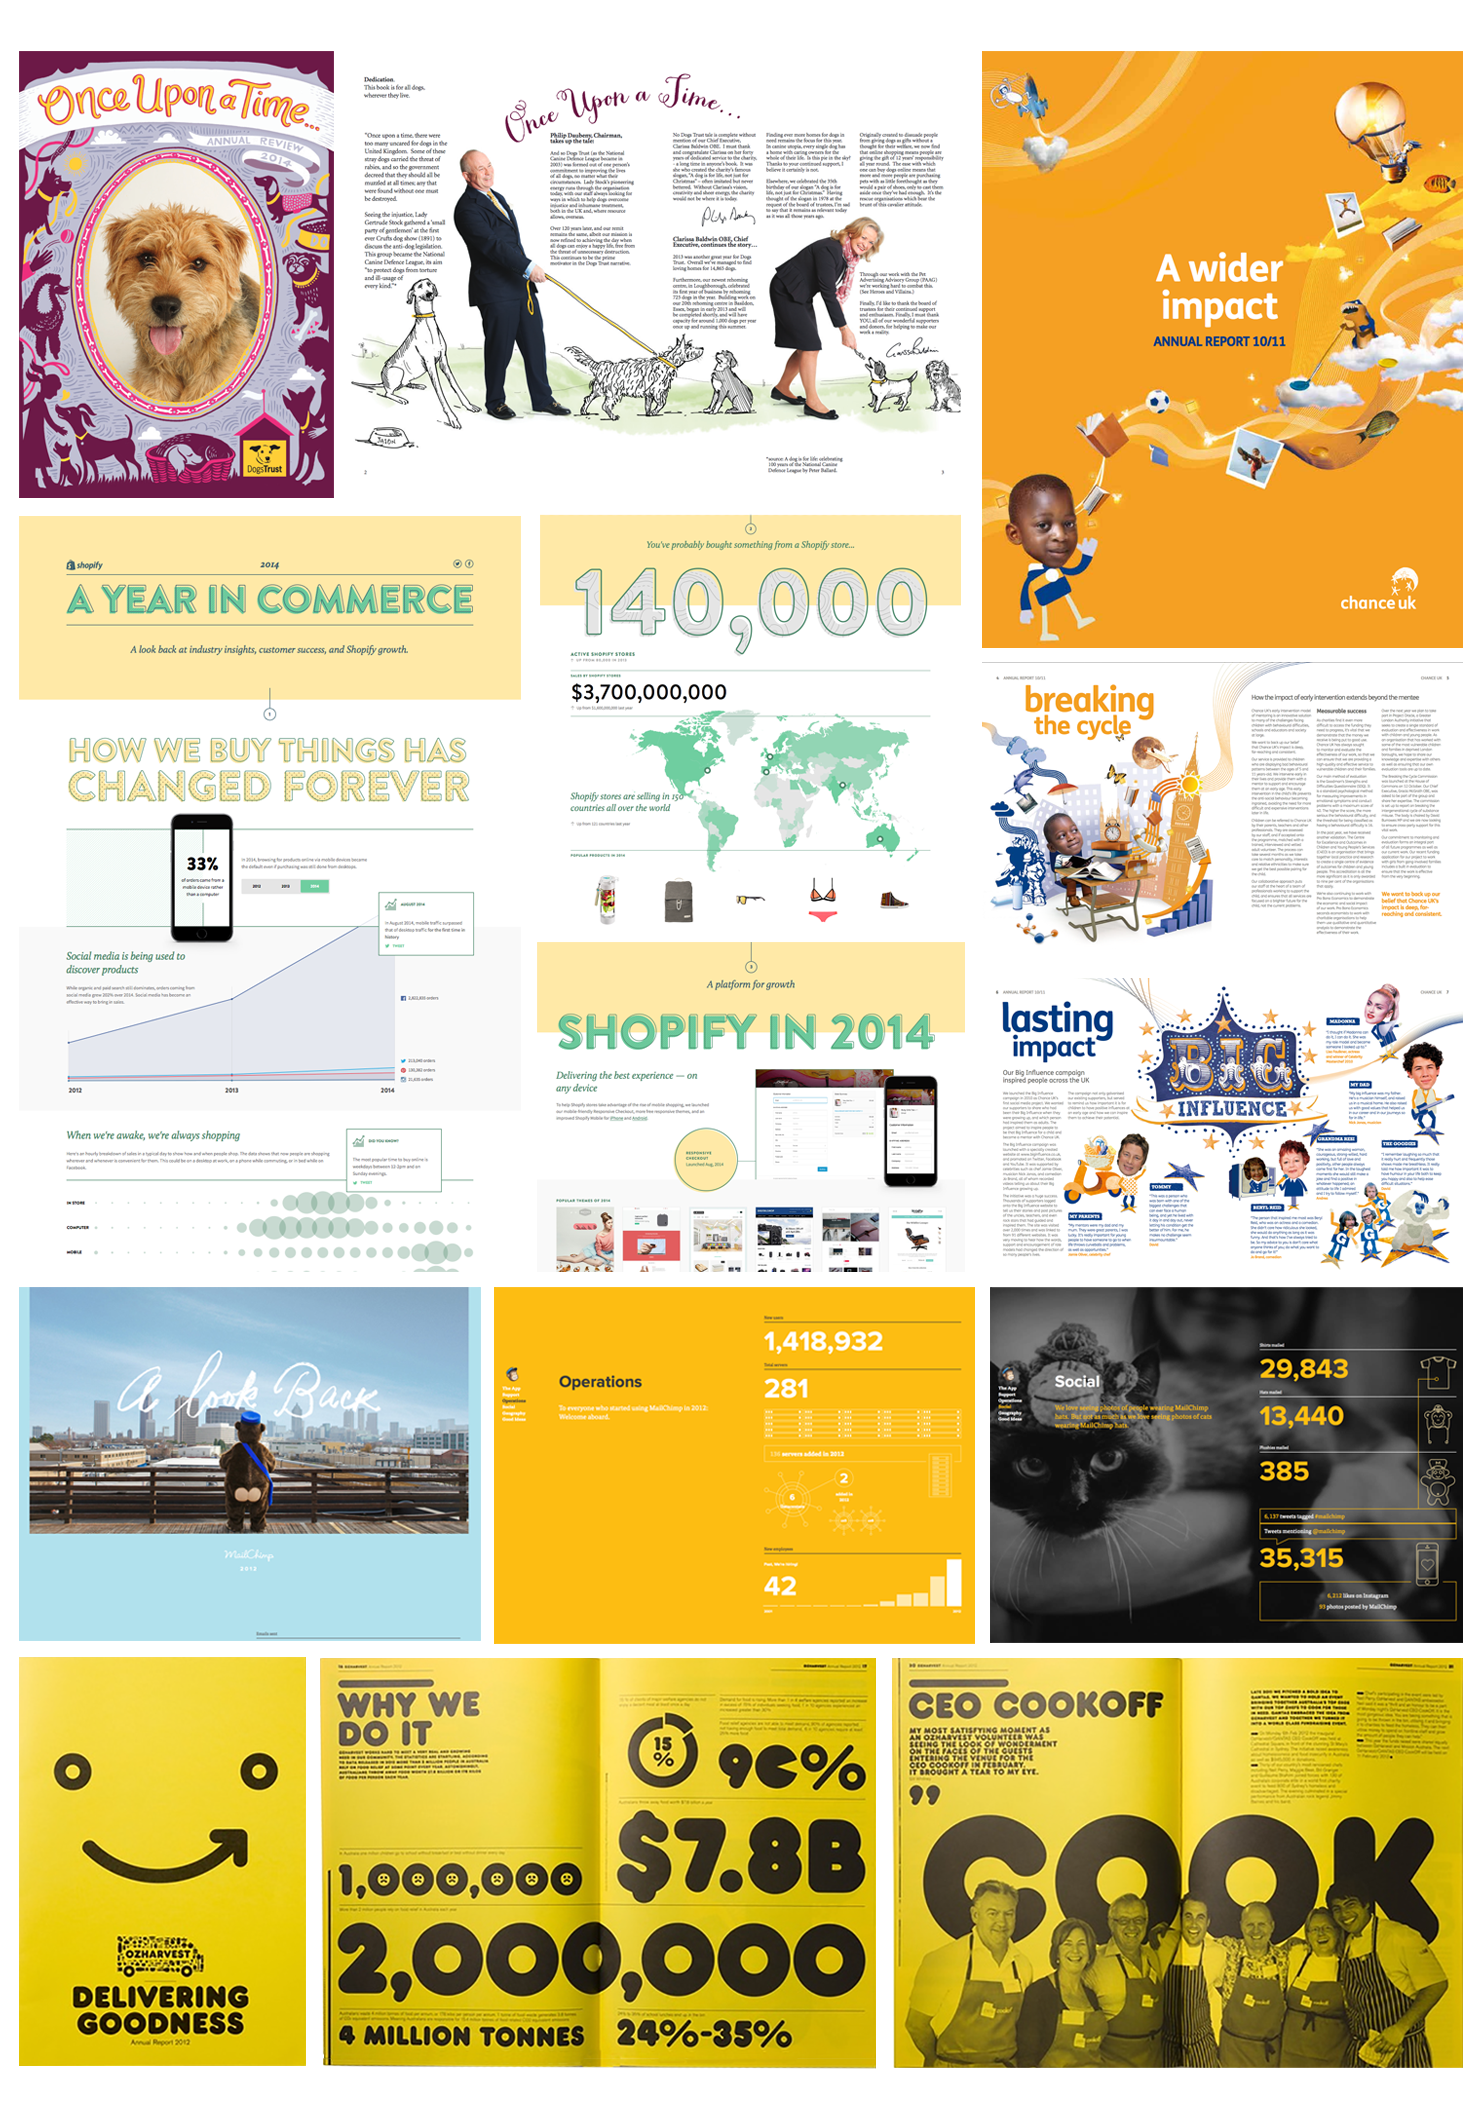
Here are a few examples of some annual reports we’ve been particularly inspired by:
 If you’d like us to take a look at your annual report (or any other type of report for that matter) and offer some good old-fashioned feedback then get in touch. We’d love to have a peek!
Sources: